PAPUA
NEW GUINEA
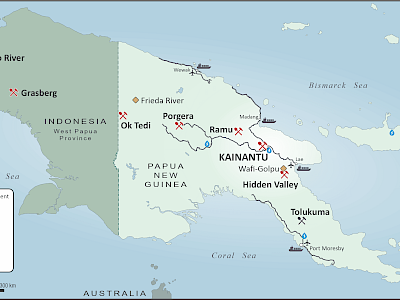
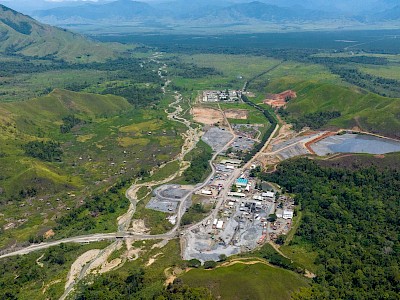
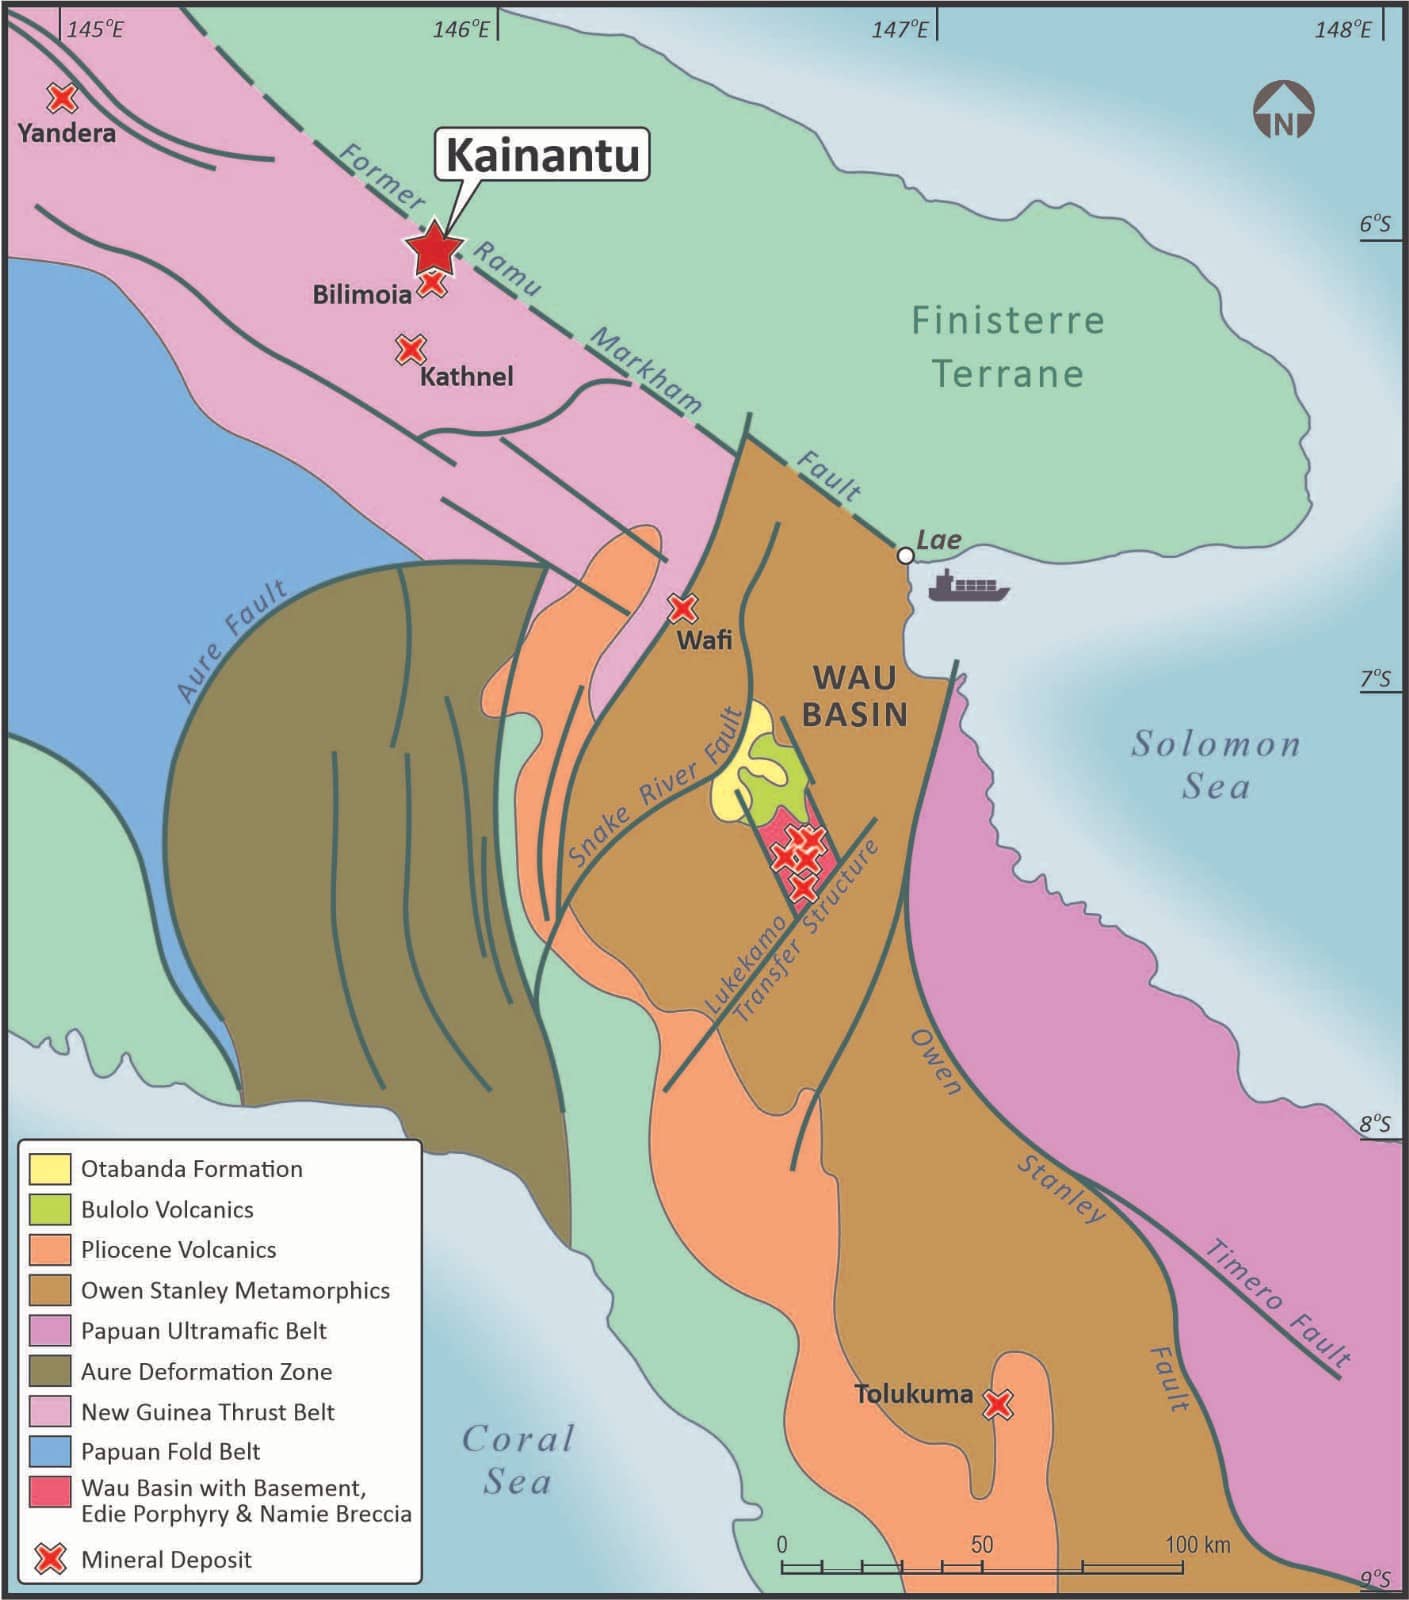
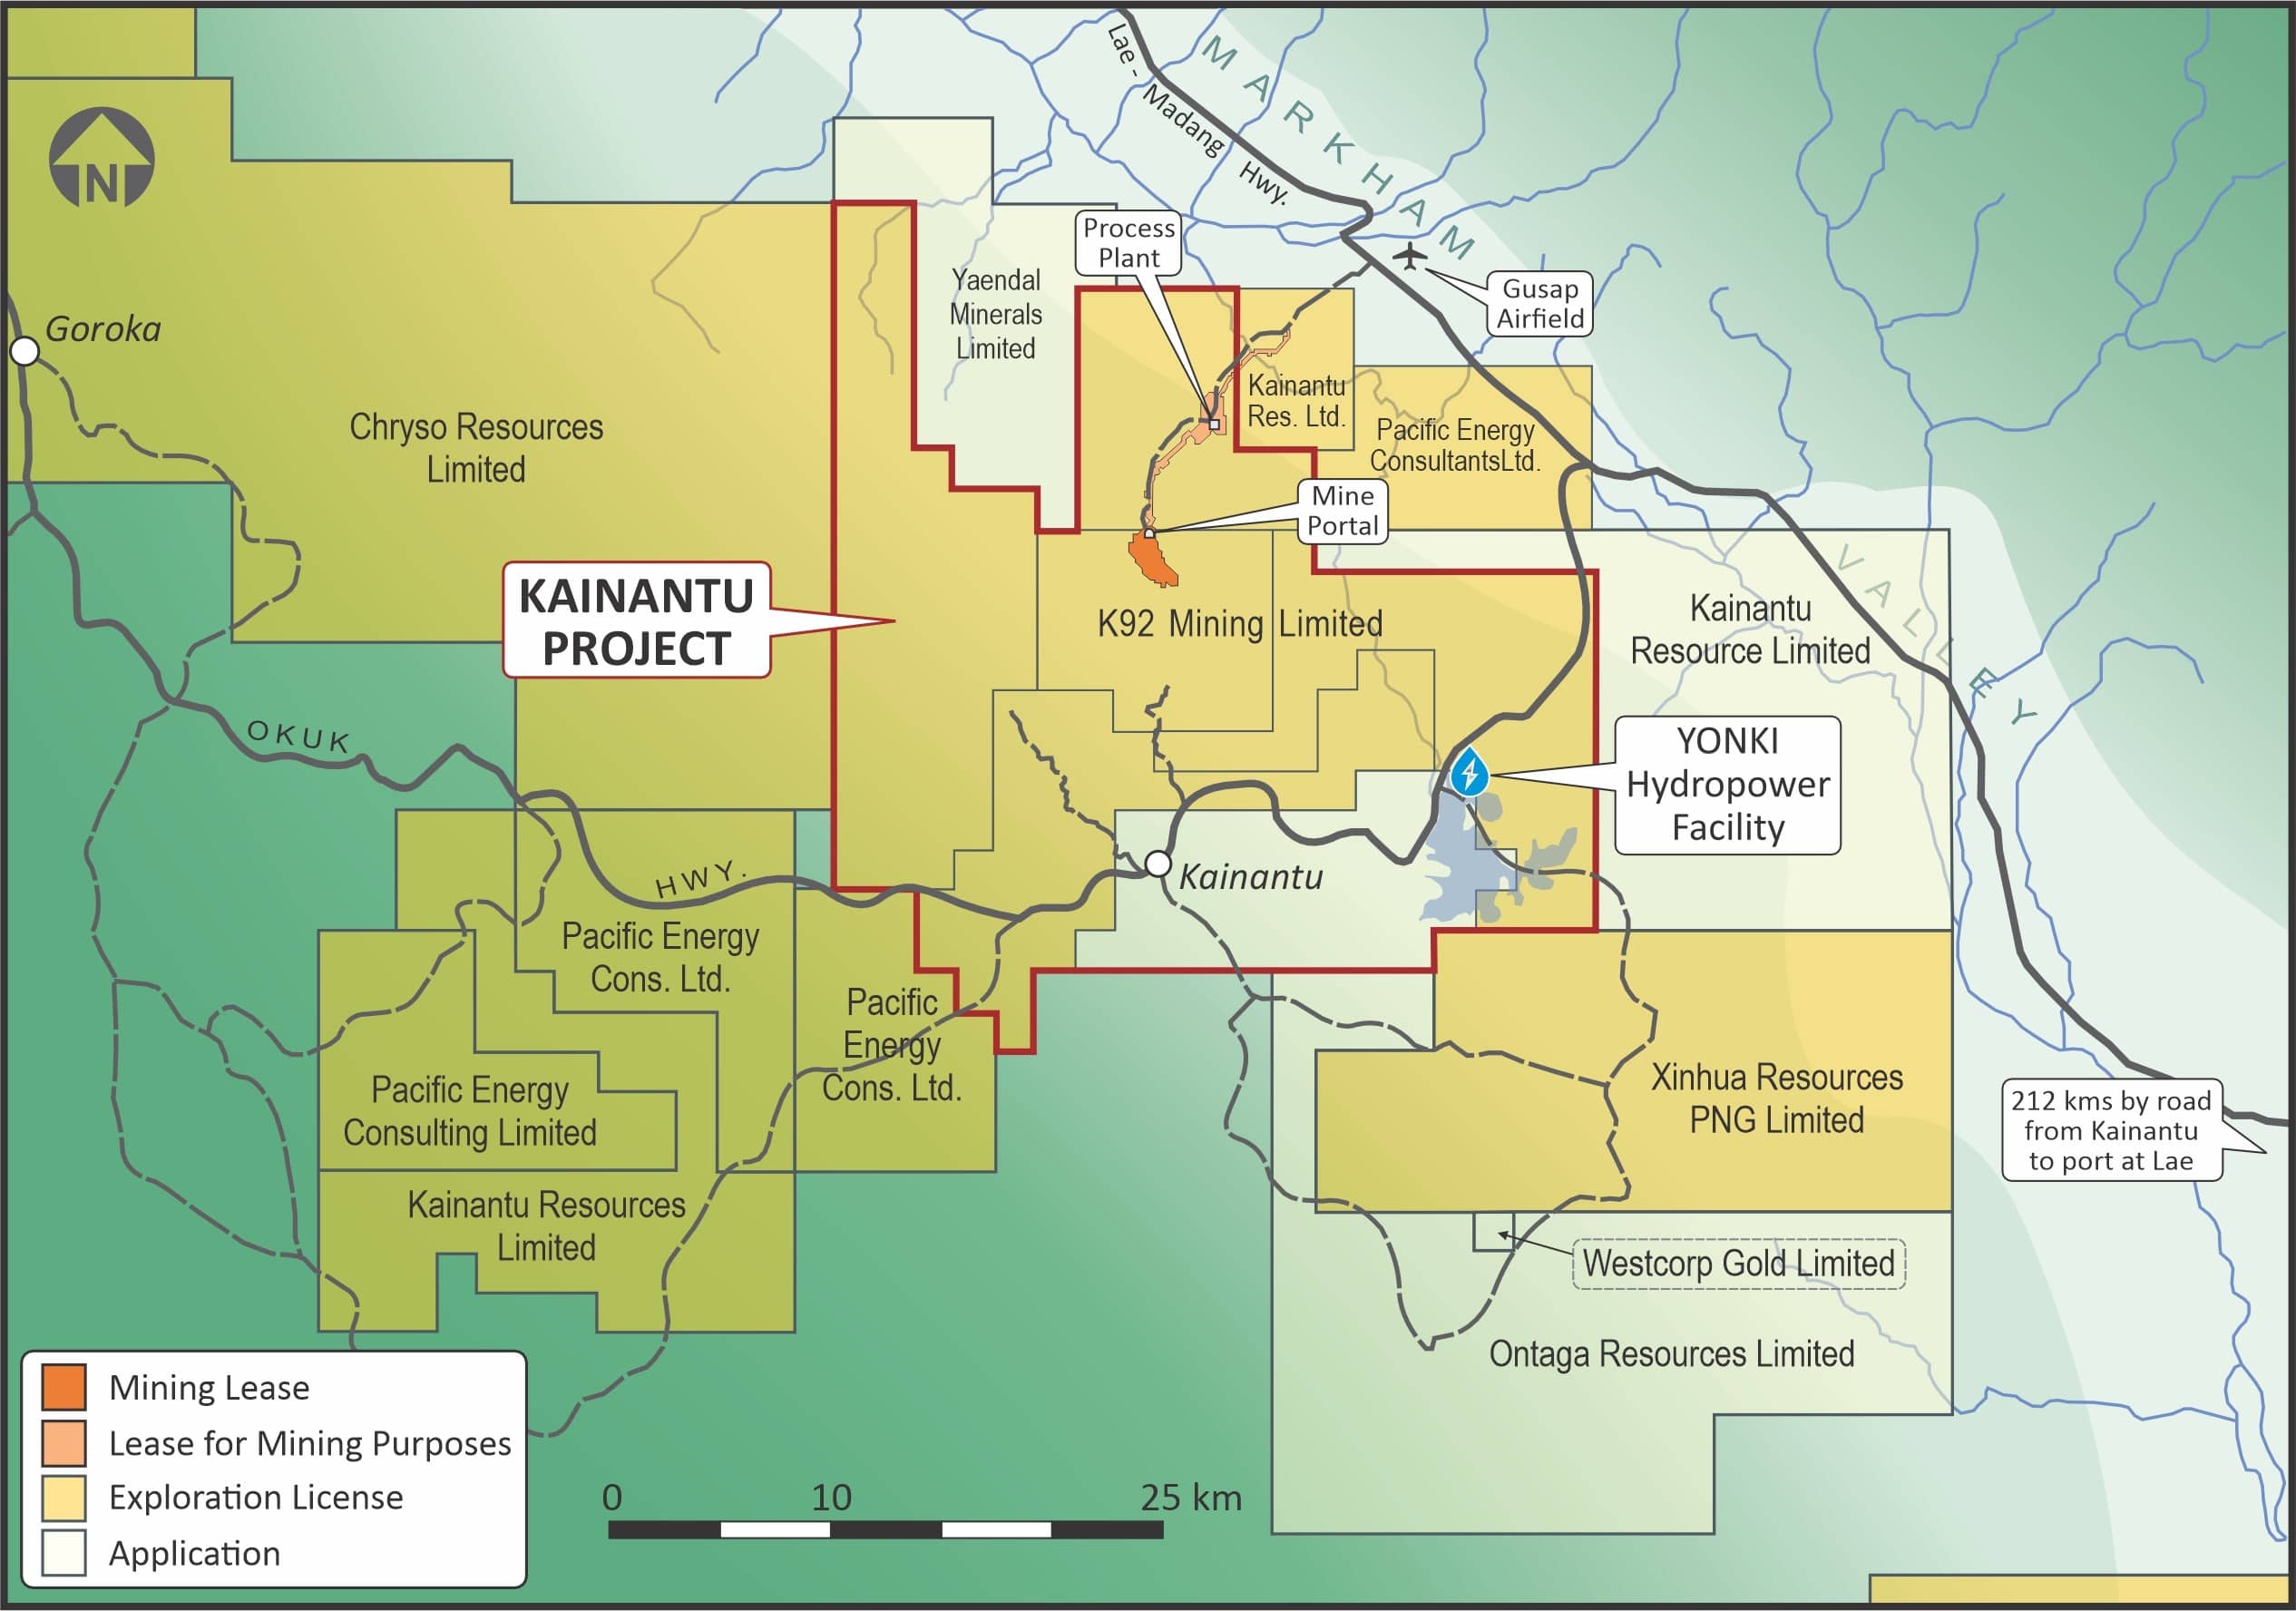
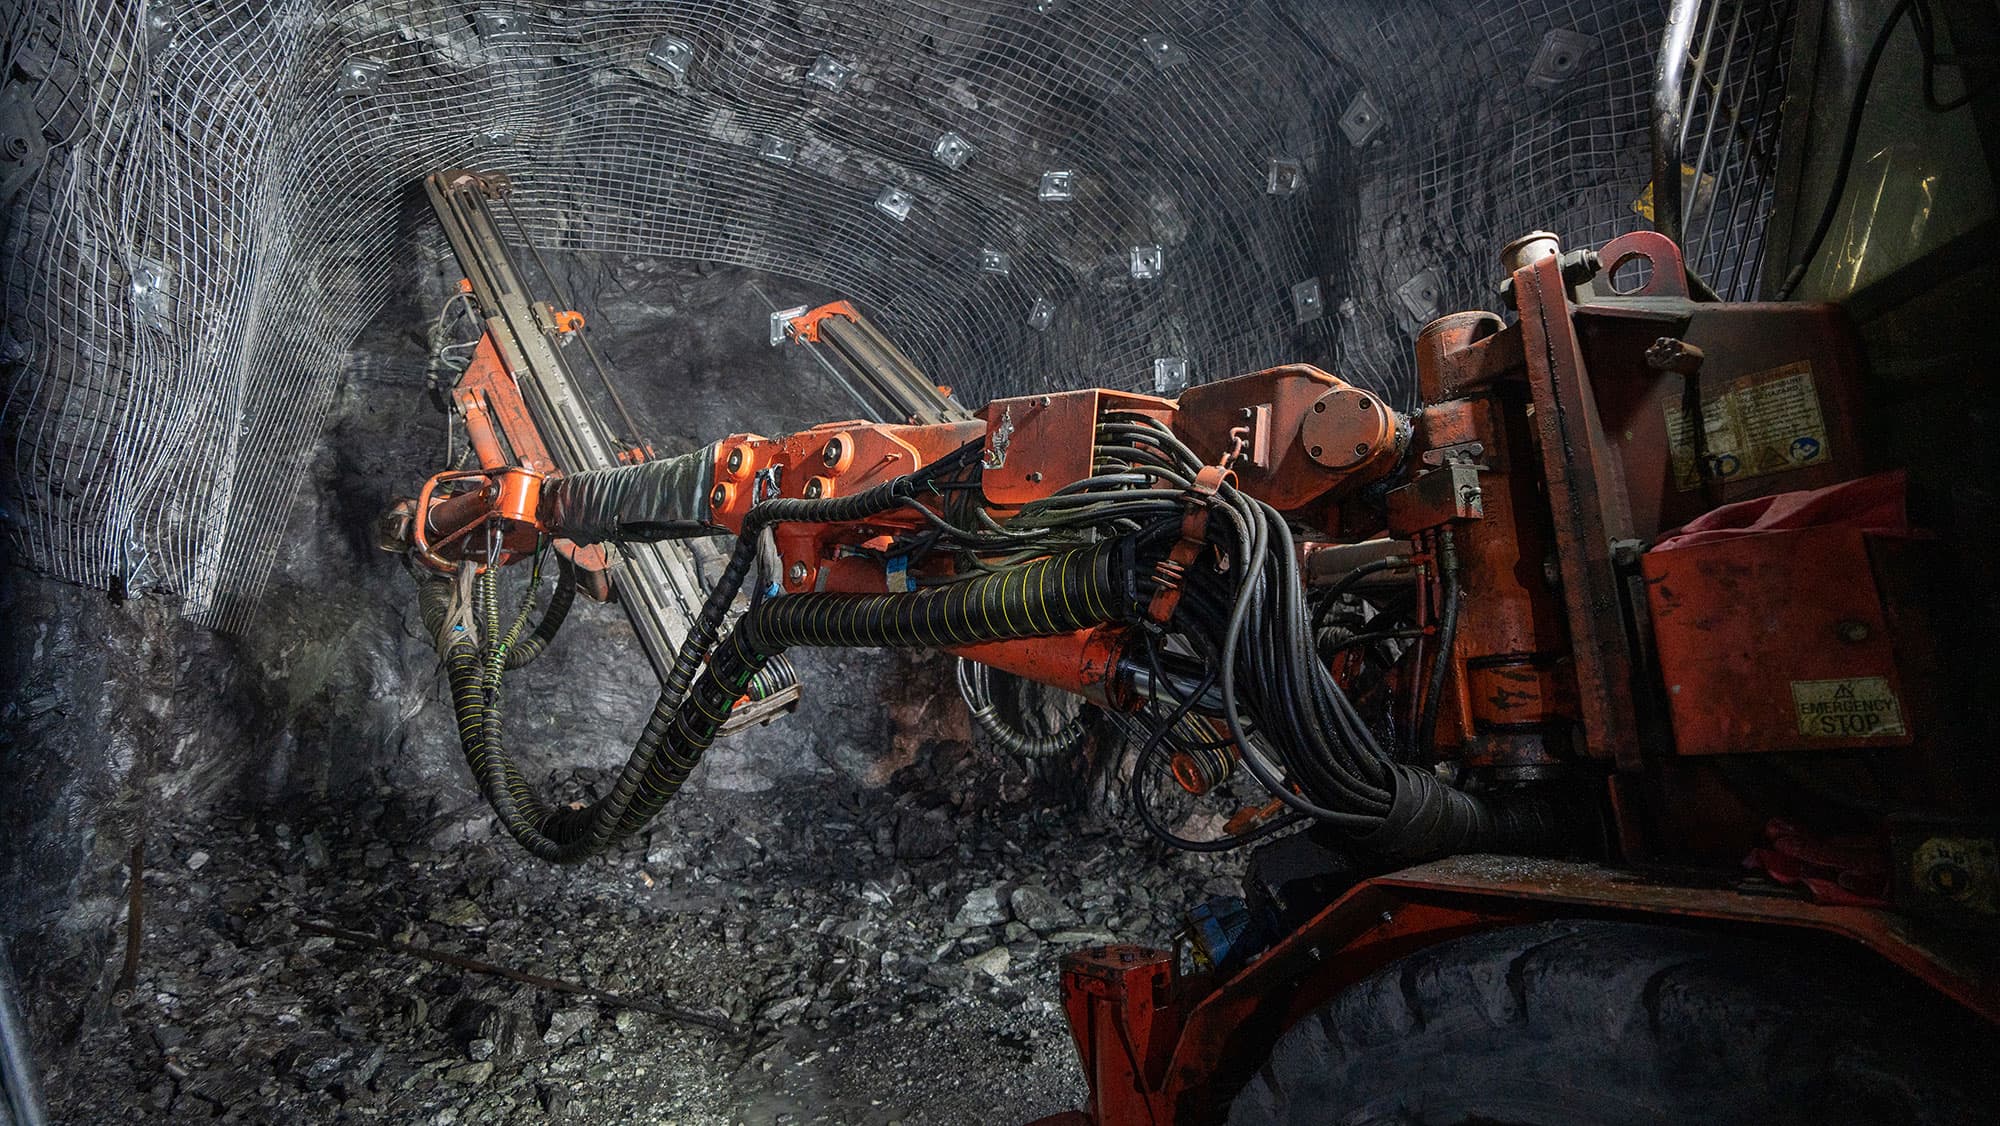
K92 Mining is focused on operating and expanding the Kainantu Gold Mine, located in Eastern Highlands province, Papua New Guinea. Since acquiring the project from Barrick Gold in 2014 and restarting in late-2016, K92 has transformed Kainantu into a rapidly expanding both producer and mineral resources. Production has also been low cost, which is a testament to the high grade, continuity, solid thickness, geotechnical and metallurgical characteristics of the deposit. The transformation was driven by a series of near-mine infrastructure exploration discoveries.
In May 2017, a near-mine infrastructure discovery of Kora North was made. This discovery ultimately combined the Kora, Eutompi and Kora North deposits into what is now known as the Kora deposit. In February 2022, following extensive underground drilling focused on upgrading Inferred resources to Measured & Indicated, K92 announced its updated Kora Resource of 2.1 moz at 9.2 g/t AuEq (7.7 g/t Au, 18 g/t Ag, 0.9% Cu) Measured and Indicated and 2.5 moz at 9.5 g/t AuEq (7.1 g/t Au, 27 g/t Ag, 1.4% Cu) Inferred. In addition, a maiden Judd Resource was announced just over a year after the discovery of high-grade underground mineralization in Q4 of 2020. The Judd main resource currently stands at 0.13 moz at 11.0 g/t AuEq (9.7 g/t Au, 18 g/t Ag, 0.7% Cu) Measured and Indicated and 0.18 moz at 5.7 g/t AuEq (4.2 g/t Au, 11 g/t Ag, 0.9% Cu) Inferred. In December 2023 K92 Mining announced yet another resource update for the Kora and Judd deposits which was achieved over a period of less than two years and at a discovery cost of less than US$7.5 per ounce gold equivalent. The combined Kora and Judd Measured and Indicated resource increased +13%, net of depletion, to 8.1 million tonnes at 10.00 g/t AuEq (7.8 g/t Au, 21 g/t Ag, 1.2% Cu) for 2.6 million ounces AuEq, and the Inferred resource increased +70%, net of depletion, to 16.5 million tonnes at 8.48 g/t AuEq (5.7 g/t Au, 27 g/t Ag, 1.5% Cu) for 4.5 million ounces AuEq.
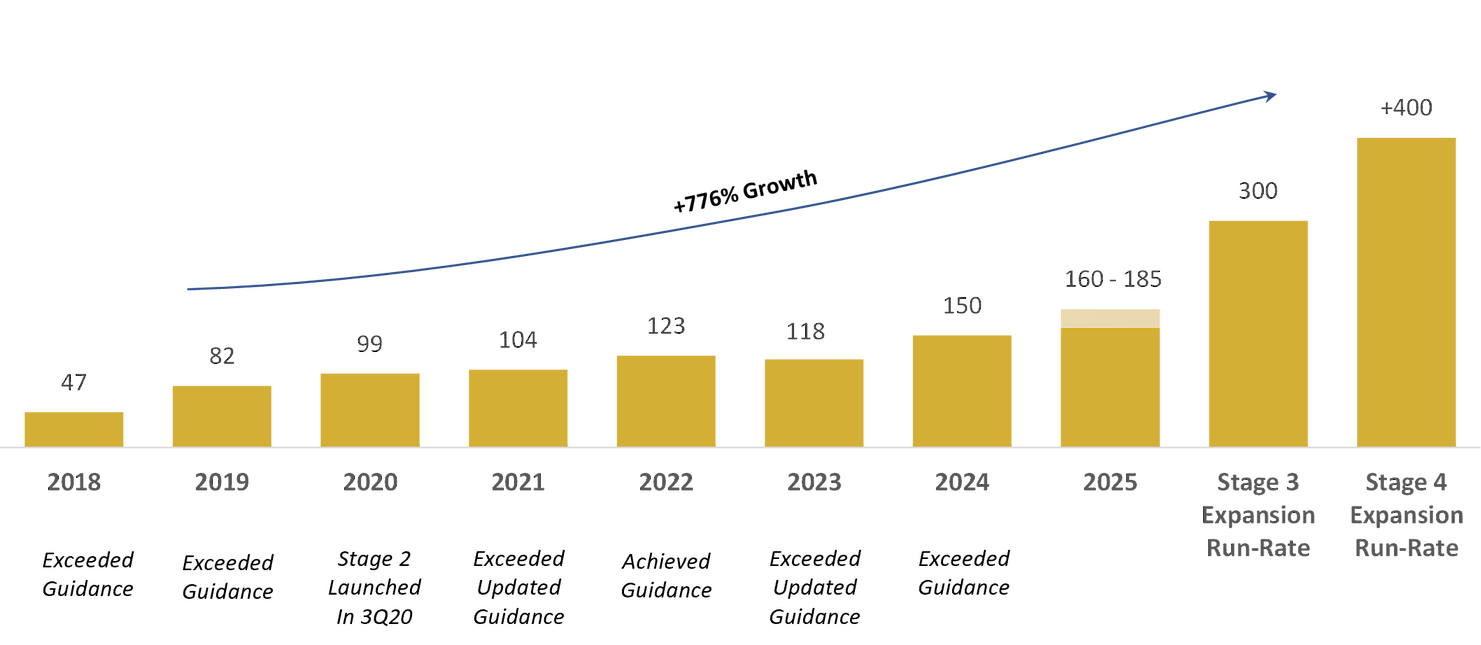
Operations are undertaking multiple stages of expansion, with Stage 2 Expansion run-rate achieved in late-2021, Stage 2A Expansion completed in May 2023 to increase throughput by +50% to +600,000 tpa (upgraded from 500,000 tpa), Stage 3 Expansion construction underway with commissioning targeting late-Q2 2025 that is expected to increase throughput to 1.2 mtpa, and a Stage 4 Expansion scheduled for commissioning in the second half of 2027 bringing throughput to 1.8 mtpa. As outlined in the October 2024 updated Stage 3 Expansion DFS study, Stage 3 is expected to achieve Tier 1 production (303 koz gold equivalent per annum run-rate, $665/oz (net of by-products) or $920/oz (co-product) life of mine average all-in sustaining costs with significant upside potential). The Stage 4 Expansion forecasts a +400 koz gold equivalent per annum production through low-capex upgrades to the Stage 3 Plant, with the Stage 2A Plant remaining available to support the next phase of expansion(1).
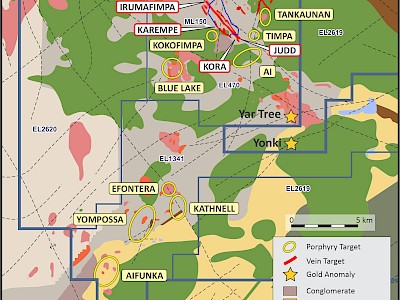
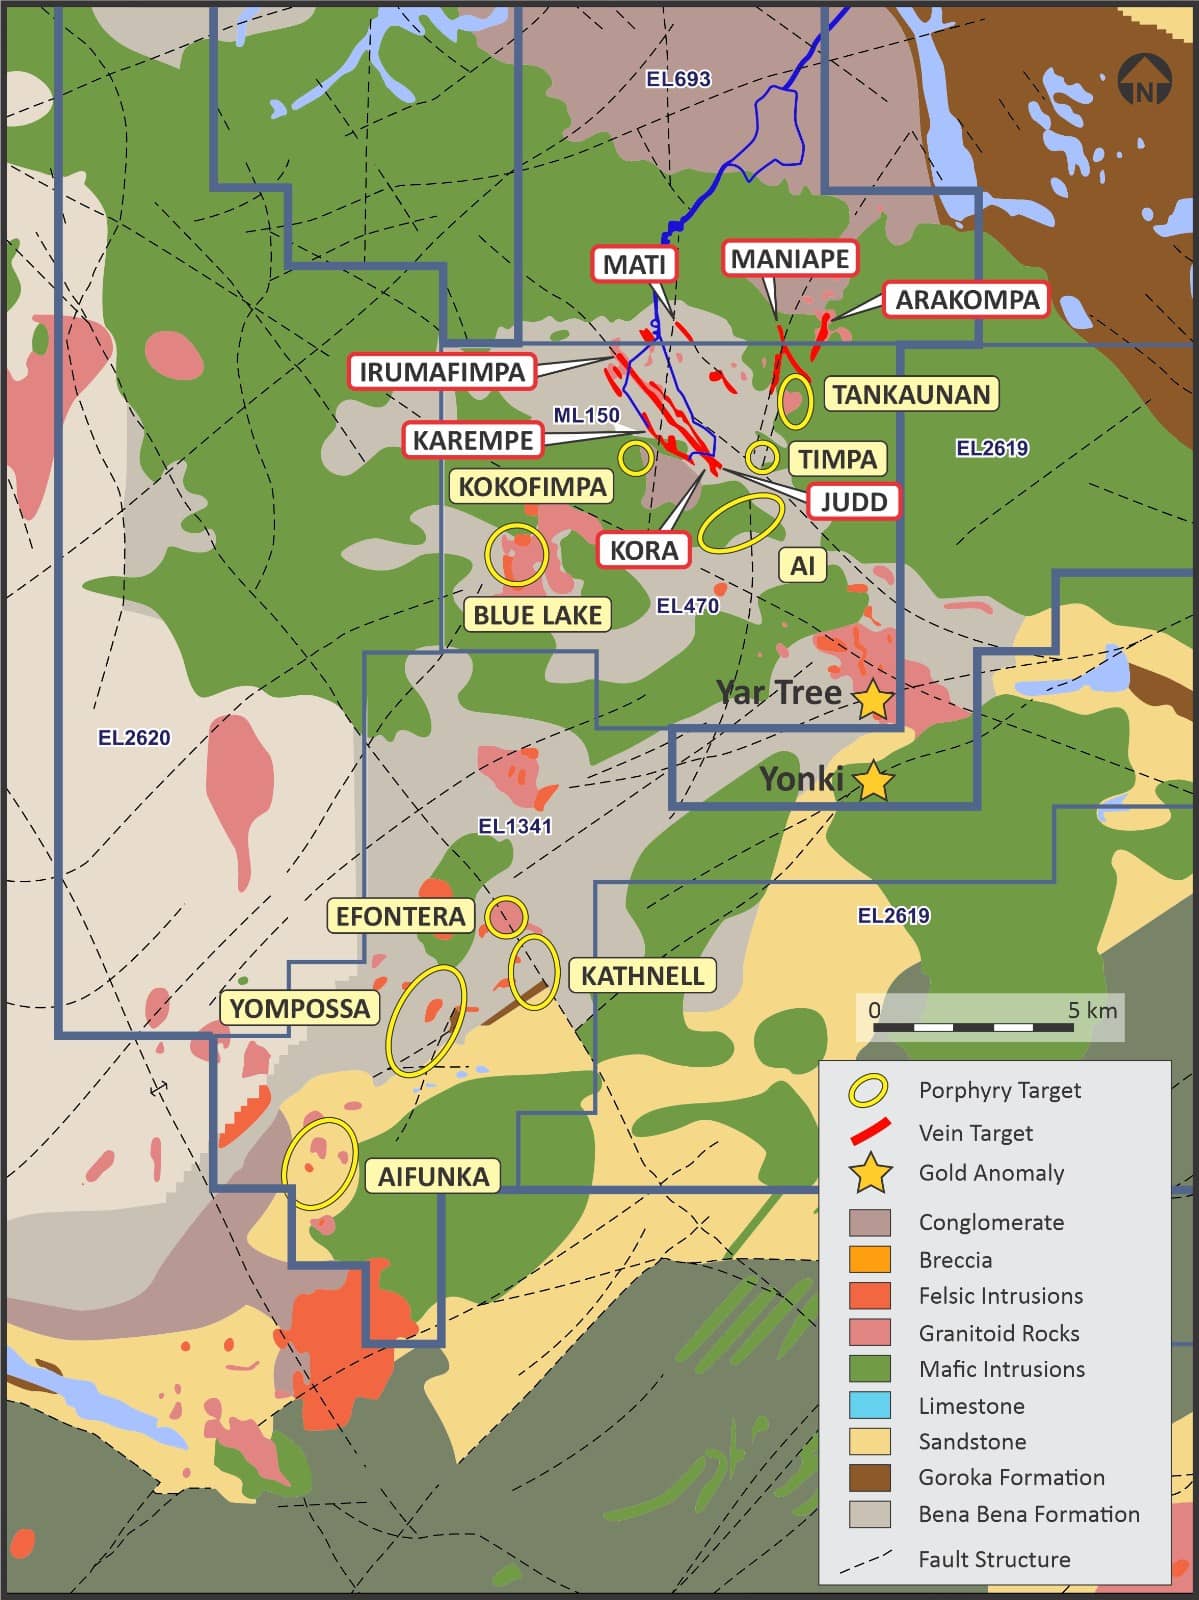
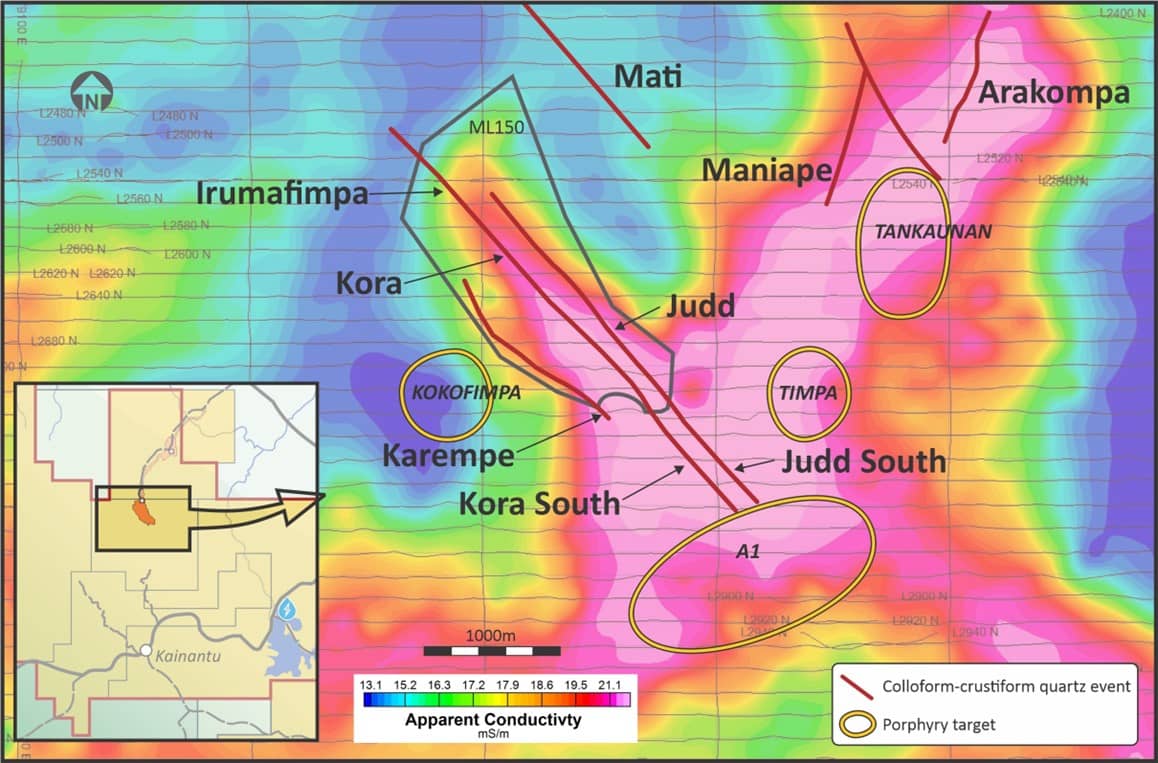
Exploration is self-funded and remains a major focus, with up to 11 drill rigs operating across multiple targets. At the Arakompa high-grade vein system, one of our highest-priority targets, up to four rigs are currently drilling the +1.7km mineralized corridor. A new compact heli-portable rig is also scheduled to arrive in mid-2025, supporting our goal of releasing a maiden resource estimate by the second half of the year.
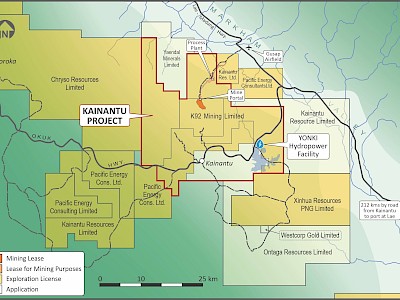
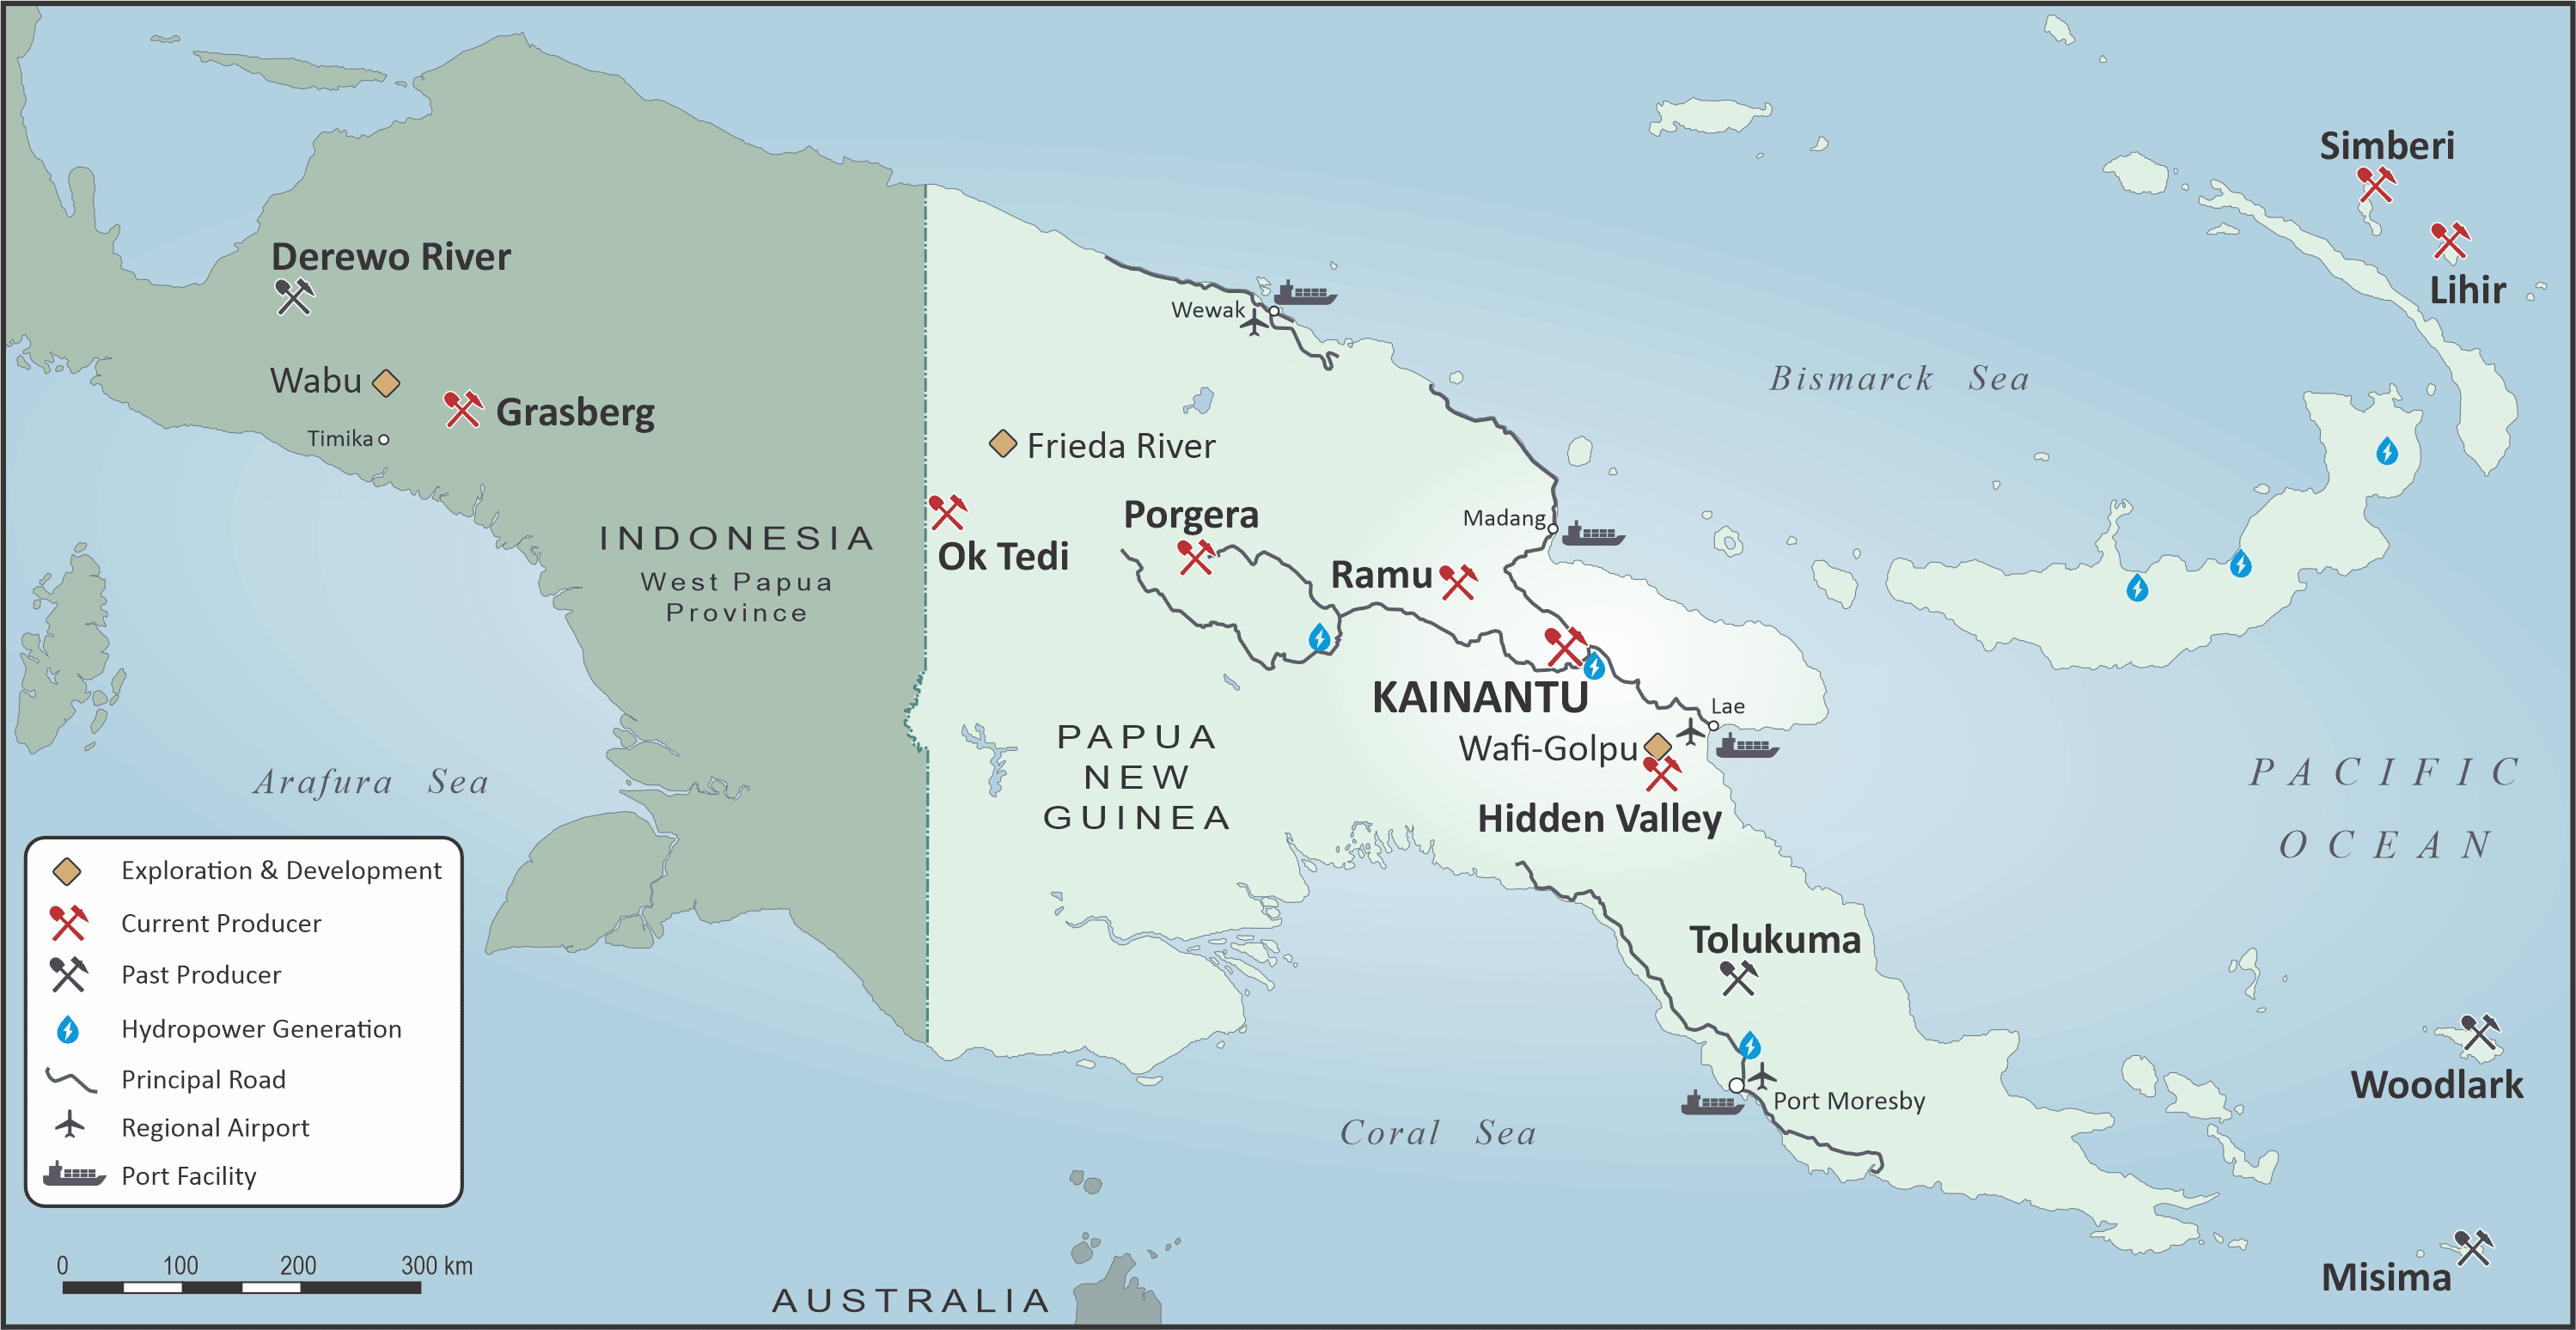
Kainantu has a large ~830km2 land package in the land of large Tier 1 Gold Assets. The property hosts many highly prospective vein field and porphyry targets. Multiple targets are being drill tested concurrently.
Note (1): Refer to the technical report titled “Independent Technical Report, Kainantu Gold Mine, Updated Definitive Feasibility Study, Kainantu Project, Papua New Guinea”, with an effective date of January 1, 2024.
Kainantu Achievements and Milestones
Feb 2024
Significant Maiden Drilling Results From ArakompaDec 2023
Kora and Judd Resource Update – 2.6 Moz AuEq M&I, 4.5 Moz AuEq InferredMay 2023
600ktpa, Stage 2A Expansion AchievedDec 2022
Extension to Mining Lease 150 to June 2034Sept 2022
Kainantu Definitive Feasibility Study (Stage 3 and Stage 4 Expansions)Feb 2022
Kora Resource Update and Maiden Judd Resource - 2.3 Moz AuEq M&I, 2.6 Moz AuEq InferredOct 2021
500ktpa, Stage 2A Expansion AnnouncedSep 2021
400ktpa, Stage 2 Expansion AchievedSep 2020
Stage 2 Expansion CommissionedJuly 2020
1mtpa, Stage 3 Expansion PEAMay 2020
Resource Update - 1.3 Moz AuEq Measured & Indicated, 3.9 Moz AuEq InferredMar 2019
400ktpa, Stage 2 Expansion AnnouncedJan 2018
Commercial Production DeclaredMay 2017
Kora North DiscoveryOct 2016
Stage 1 Production Restart - 200ktpaSTAGE 3 DFS EXPANSION SUMMARY(1)
| MINE LIFE & MATERIAL MOVEMENTS | Stage 3 DFS | |
| Mine Life | 7 Years | |
| Throughput | 1.2 mtpa | |
| Total Ore Mined | 6.2 mt | |
| LOM AVERAGE GRADES | ||
| Gold Grade | 6.7 g/t | |
| Copper Grade | 1.0% | |
| Silver Grade | 19 g/t | |
| AuEq Grade | 8.5 g/t | |
| AVERAGE RECOVERIES | ||
| Gold Recovery | 93% | |
| Copper Recovery | 94% | |
| ANNUAL PRODUCTION (AuEq) | ||
| Stage 3 Run-Rate | 303 koz | |
| LOM Avg | 223 koz | |
| Peak | 319 koz | |
| COSTINGS | ||
| Expansion Capex | $194M | |
| Sustaining Capex | $337M | |
| Avg Unit Costs | $145/t | |
| LOM Avg Cash Cost (co-product) | $694/oz | |
| LOM Avg Cash Cost (net of by-product) | $380/oz | |
| LOM Avg AISC (co-product) | $920/oz | |
| LOM Avg AISC (net of by-product) | $665/oz | |
Note (1): Refer to the technical report titled “Independent Technical Report, Kainantu Gold Mine, Updated Definitive Feasibility Study, Kainantu Project, Papua New Guinea”, with an effective date of January 1, 2024.